A new report has highlighted the extent to which minority groups in Glasgow suffer the worst of the air pollution, revealing that one in three people within the Indian community live in areas where they are exposed to the worst levels of NOx and PM2.5.
The new research forms part of the The Glasgow Environmental Monitoring of Indoor and Outdoor Air (GEMINOA) project and was undertaken in response to a 2022 report which revealed how economically vulnerable communities were more like to suffer the effects of three climate-related hazards: flooding, high temperature and poor air quality,
In recent, Glasgow’s ethnic minority population has grown from under 12% to nearly 20% of the local authority population and the new research looks at how those groups are being exposed to NOx and PM2.5 emissions, both at home and at school.
For this study, Allison Catalano, a Fellow at the Fraser of Allander Institute, used census data from 2022 and DEFRA’s air quality predictions for the same year – these predictions being based on traffic and meteorological data from 2018.
The city was divided into deciles, sorted by maximum annual mean concentration for both NOx and PM2.5 concentrations.
For NOx, decile 1 – the least polluted area – had a maximum mean concentration of 11.9µg/m³. At the other end of the scale, decile 10 had a maximum mean concentration of 32µg/m³
For PM2.5, decile 1 had a maximum mean concentration of 4.8µg/m³, while decile 10 was 6.56µg/m³
For both pollutants the Indian community¹ was significantly more likely to live in the decile with the highest levels. 34% of the group living in areas with the worst NOx levels and 27% in the areas with the worst PM2.5 levels.
The Chinese community² fare little better, with 29% of that group suffering the worst NOx and 19% the worst PM2.5.
Interestingly, the ‘White Scottish or Other White British’ group were distributed extremely evenly through the ten groups of air quality levels. For example 10% of them live in areas with the best NOx levels, 10% in the 5th decile and 11% in the worst area.
Similarly, for PM2.5 those figures are 11%, 10% and 9%.
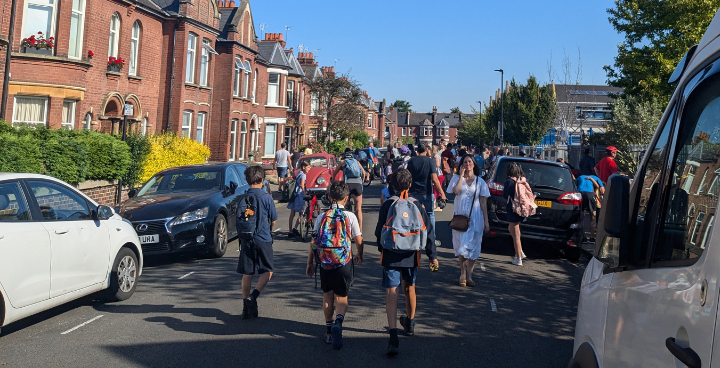
Studying air quality at schools showed that children from ethnic minority groups were considerably more likely to attend schools in areas with the worst air quality for those two pollutants.
One surprise from study was that while belonging to a particularly ethnic group is a strong determinant of the air quality people will be exposed to, income was not found to be a significant factor: ‘There is not generally a clear relationship between income and pollutant concentrations in general. This is surprising, given that one previous study found that areas with higher rates of income deprivation generally had higher rates of air pollution in the greater Glasgow metropolitan area.
‘This difference in findings likely comes down to these boundaries, but by focusing on Glasgow City Council, we are able to isolate areas relevant to local policy makers.’
The full report can be read here
¹Defined in the report as Indian, Indian Scottish or Indian British
²Defined in the report as Chinese, Chinese Scottish or Chinese British





Leave a Reply