


A new study using data from Japan’s GOSAT-2 satellite is offering an insight into how much pollution the world’s major cities are actually producing and revealing that widely used emissions databases may be off the mark, especially when it comes to developing countries.
GOSAT-2, launched in 2018 by Japan’s Ministry of the Environment, the National Institute for Environmental Studies, and the space agency JAXA, is designed to measure greenhouse gases like carbon dioxide (CO2), carbon monoxide (CO) and methane (CH4) from space.
It uses light reflected off the Earth’s surface to analyse how much of these gases are in the air over different parts of the world.
The research team focused on 40 of the world’s most populated cities between 2019 and 2023, aiming to estimate the amount of pollution these cities were releasing.
Instead of trying to measure the total volume of emissions directly, they used “enhancement ratios” to compare how much more CO₂, CH₄, and CO was present over a city compared to nearby rural areas. These ratios can reveal how different gases are being emitted together and in what proportions.
As they explain: the enhancement ratio for Beijing is approximately 4.3 times that of Tokyo. The implication is that when the same amount of CO2 is emitted in Tokyo and Beijing, the amount of CO emitted together with CO2 in Beijing is approximately 4.3 times that emitted in Tokyo and hence likely to exacerbate air pollution.’
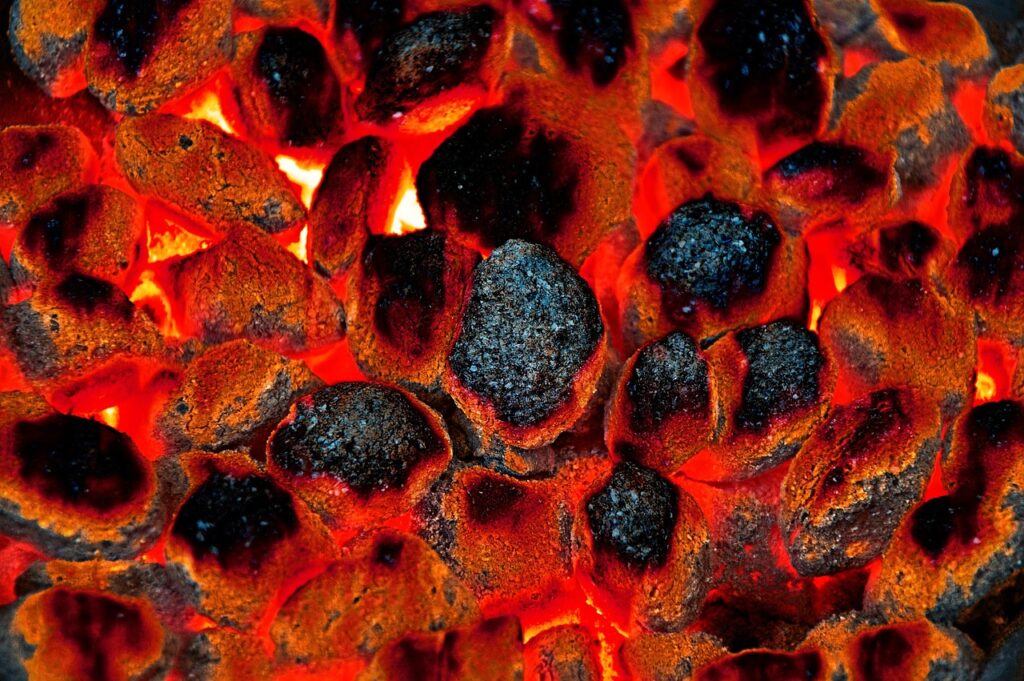
The team speculate that this scenario is caused by China’s greater use of coal and inefficient combustion from outdated equipment.
The team compared these satellite-derived emission patterns to estimates from global databases such as the Emissions Database for Global Atmospheric Research (EDGAR) and the Open-source Data Inventory for Anthropogenic CO₂ (ODIAC), to test how accurate the databases really are.
In wealthier countries, the satellite data matched the database figures fairly well. But in many developing cities, the satellite data suggested significantly higher levels of CO and CH₄ emissions than the databases reported.
Methane emissions were underestimated in no less than 74% of the cities studied, and carbon monoxide in 76%. The researchers suspect this may be due to emissions from gas leaks or household fuel use not being fully captured in traditional reporting methods.
While the team concede that the satellite method isn’t perfect – it may be influenced by weather and other local conditions – it offers a powerful tool to check and improve existing emissions databases, especially in places where data is scarce or unreliable.
The full research can be read here.
Leave a Reply