











A new online tool is giving scientists, journalists and the public a clearer picture of how wildfires are affecting the planet, allowing users to track fire emissions and smoke movement around the world almost in real time.
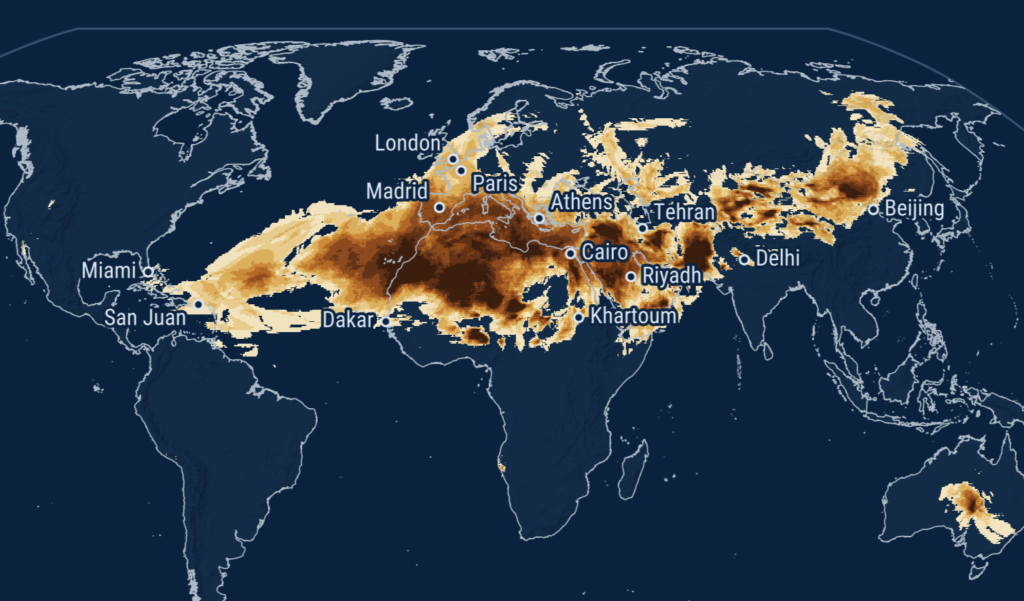
The Copernicus Atmosphere Monitoring Service (CAMS) has launched Fire Emissions Watch, an interactive application designed to make complex wildfire data easier to explore. The tool uses information from CAMS’ Global Fire Assimilation System (GFAS), combining satellite observations of fire activity with forecasts showing how smoke plumes move through the atmosphere.
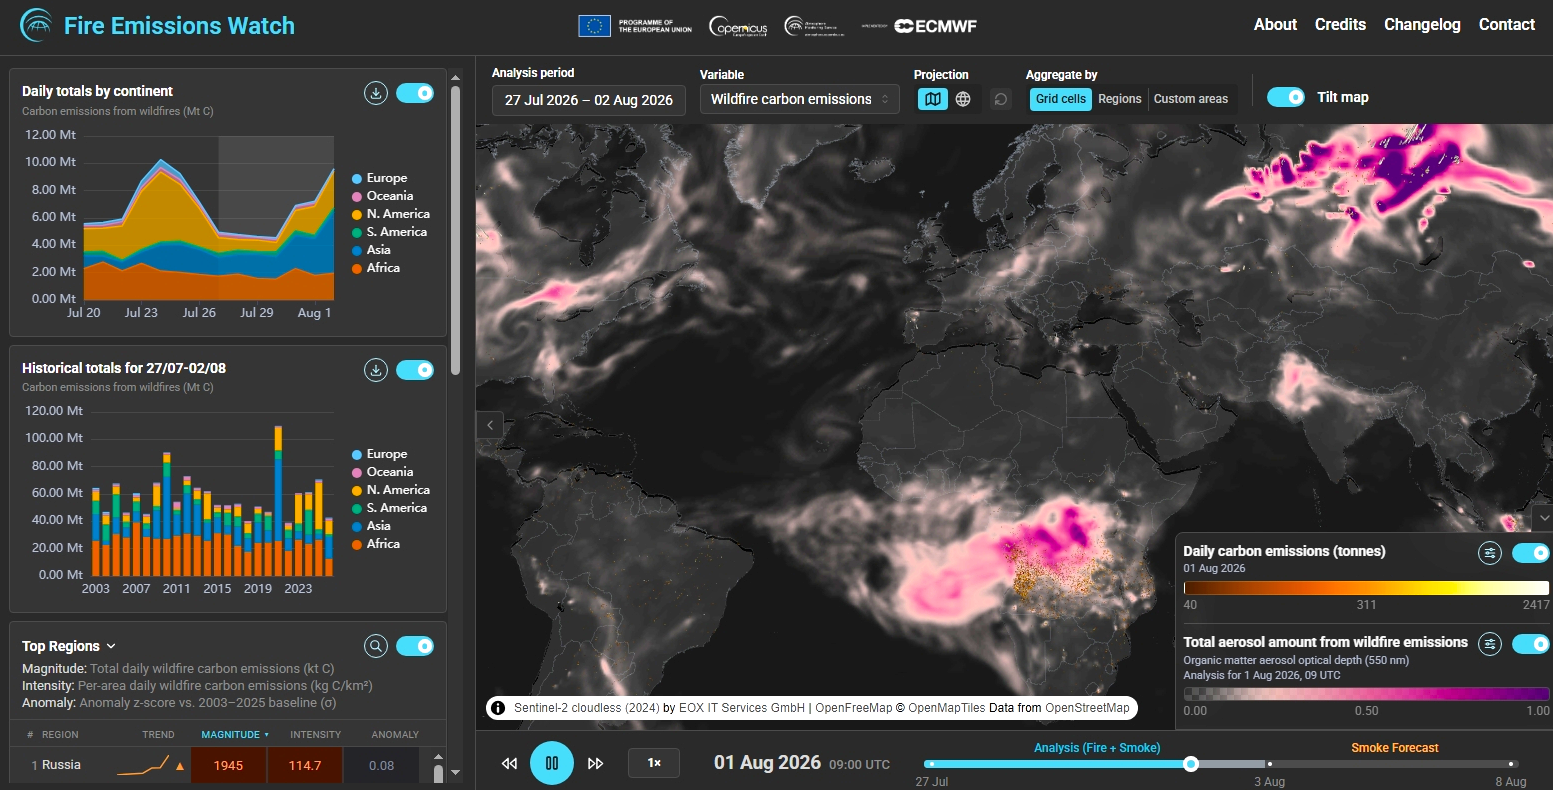
Users can explore wildfire emissions by country, region or their own chosen area, view daily, monthly and annual trends, and replay smoke transport over selected time periods. The application focuses on carbon emissions, but the underlying GFAS dataset also provides information on other pollutants released by fires.
The tool has already highlighted the exceptional scale of recent fires in France, where wildfire emissions during July reached their highest level on record. By the end of the month, France had recorded 0.89 megatonnes of carbon emissions, surpassing the previous record of 0.64 megatonnes set in 2022.
Fire Emissions Watch also shows the intensity of fires through Fire Radiative Power (FRP), a measurement based on satellite observations that helps estimate emissions in near real time. While FRP generally follows carbon emission levels, researchers said differences between the two measures highlight the unusual intensity of some recent fires.
The data captures major outbreaks including fires in the Fontainebleau forest near Paris and several locations in south-east France, alongside smaller fire events elsewhere.
Laurence Rouil, Director of CAMS, said: ‘Fire Emissions Watch is ought to be a gamechanger in global fire emissions monitoring,” she said. “The application displays the wealth of information of our GFAS dataset in a very intuitive and innovative way, enabling users, researchers and media to understand fire emissions in a totally new way.’
The tool can also look back through two decades of fire records, allowing users to compare current events with major wildfire seasons from the past. Historical events available to explore include extreme fires in Russia’s Far East, the Amazon rainforest fires of 2019, Canada’s record-breaking wildfire emissions in 2023 and European heatwave-related fires in 2003.
For July 2026, the data showed the highest wildfire emissions were recorded in Canada, where thousands of intense fire hotspots were detected. The application also allows users to track how smoke from fires travelled across regions, including periods when parts of the US East Coast experienced air quality concerns.
Sebastian Steinig, Data Visualisation Developer at CAMS, said: ‘It has been a great team effort from many people at ECMWF developing the initial proof-of-concept to streamline the work they were doing on the monitoring and analysis of wildfire activity. The latest technology developments at ECMWF and the possibilities opened by the ARCO datasets finally enable us to explore large datasets directly in the browser. We hope the app will help everyone have a new perspective on wildfire emissions.’
Click here to access the Fire Emissions Watch application
Leave a Reply